Rationale
Oftentimes it can be helpful as developers to view a visual representation of the data model within an application. Beyond development, having a good way to explain and discuss the architecture of a data model is often useful when planning features with non-development focused stakeholders. When sharing these diagrams with product owners or within docs, it's often necessary to tweak the design or layout to fit the situation.
While there are a number of good tools for generating these diagrams from a Rails app's code base, the output is usually a static image or PDF, both of which can be a challenge to edit or modify. Oftentimes, this makes it difficult to clean them up for embedding in other documents as well.
When working on documentation for a client here at Headway, I came across a method for combining an automatic tool with Google Drawings to make a diagram that's easy to embed in a Google Doc and yet also easy to edit later if need be.
Creating the Diagram
First, let's generate an SVG of the entity relationships to work from:
1. Start by adding the `erd` gem as follows:
In your `Gemfile` add
gem 'erd'
Then run
bundle install
2. To configure how the diagram is built, in your project root add an `.erdconfig` file.
Here you can exclude models and certain types of fields, but our main concern is to change the output format to SVG.
Here’s an example that you can tweak as needed:
attributes:
  - content
  - foreign_key
  - inheritance
exclude:
    - ActiveRecord::DataMigration
  - Delayed::Backend::ActiveRecord::Job
filename: erd
filetype: svg
indirect: true
inheritance: false
orientation: horizontal
title: Application ERD
3. Then, in your project directory run `rake erd` to have the SVG generated
4. Upload this file to a location on Google Drive
Getting it into a Google Drawing
After successfully exporting an SVG, we’ll use Google Docs and a connected application to get our diagram into an editable Google Drawing.
1. To get our SVG into a format that Google Drawings can use, we’ll convert it to an EMF file.
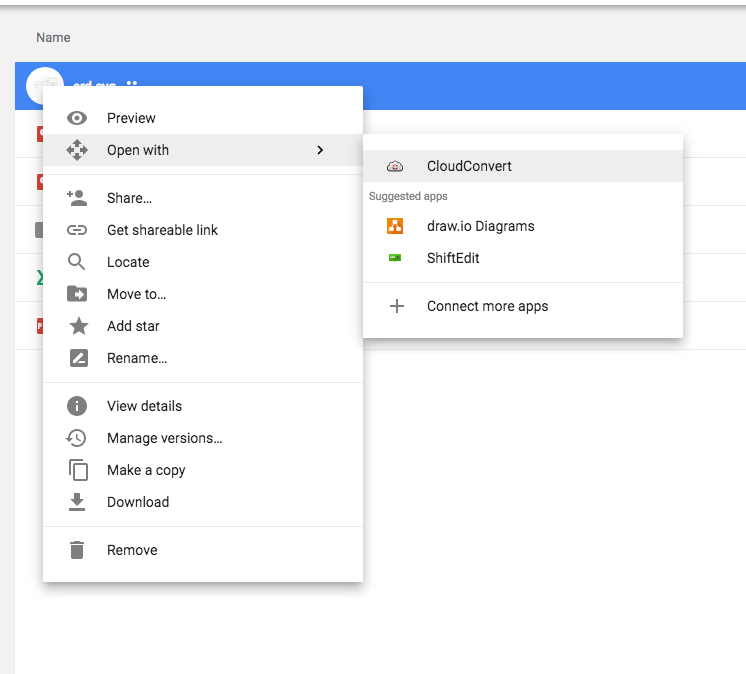
Unfortunately, my attempts to create an EMF with local tools resulted in a number of metafiles that Google Drawings couldn't process. Instead let’s make use of a tool called Cloud Convert. Right-click on the file, and choose `'Open With' -> 'Cloud Convert'`.

2. Then, you’ll need to grant Cloud Convert access to your Google Drive to be able to read in the source file and export out the converted output.
3. Within Cloud Convert, choose `'Vector' -> 'emf'` in the drop-down to the right of your file and click
'Start Conversion'.

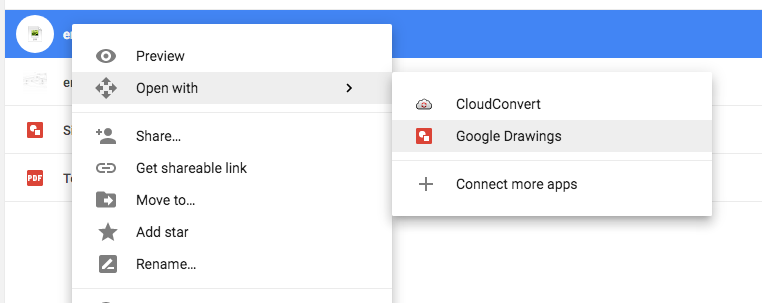
4. By default, the output file is automatically saved in Google Drive at the same location as the original SVG. Now that we have a usable EMF, you can right-click on the file and open it in Google Drawings.

5. Edit the final diagram to your heart’s content!
References:
This process was inspired by this Stack Exchange Question.


