Every design system team eventually makes the slide: a big number, a percent sign, and the word "adoption" underneath. It might say 65%. Thirteen of the twenty repos import the design system packages.
It's a real number. It's a useful number. On its own, it tells you almost nothing about whether the design system is working.
Adoption metrics have blind spots
Adoption answers one question: Is the system in the codebase? It doesn't answer the questions that decide whether your system survives its next budget review.
- Is it helping?
- Is the relationship between the system team and the product teams healthy?
- Are teams leaning in, or quietly routing around you?
For that, you need a second metric. We call it engagement. After tracking it every month for half a year, I'd argue it's the more honest of the two.
Engagement is the missing piece
Adoption measures the artifact and where you’ve been. Engagement measures the relationship and tells you where you’re headed. You need both.
Adoption is worth measuring, so measure it in layers
Adoption is always going to be the baseline; without it, you won’t have a foundation to start tracking engagement, or to work your way up the five levels of an AI-ready design system. So what are some of the things we look at when we’re looking at adoption and setting that baseline?
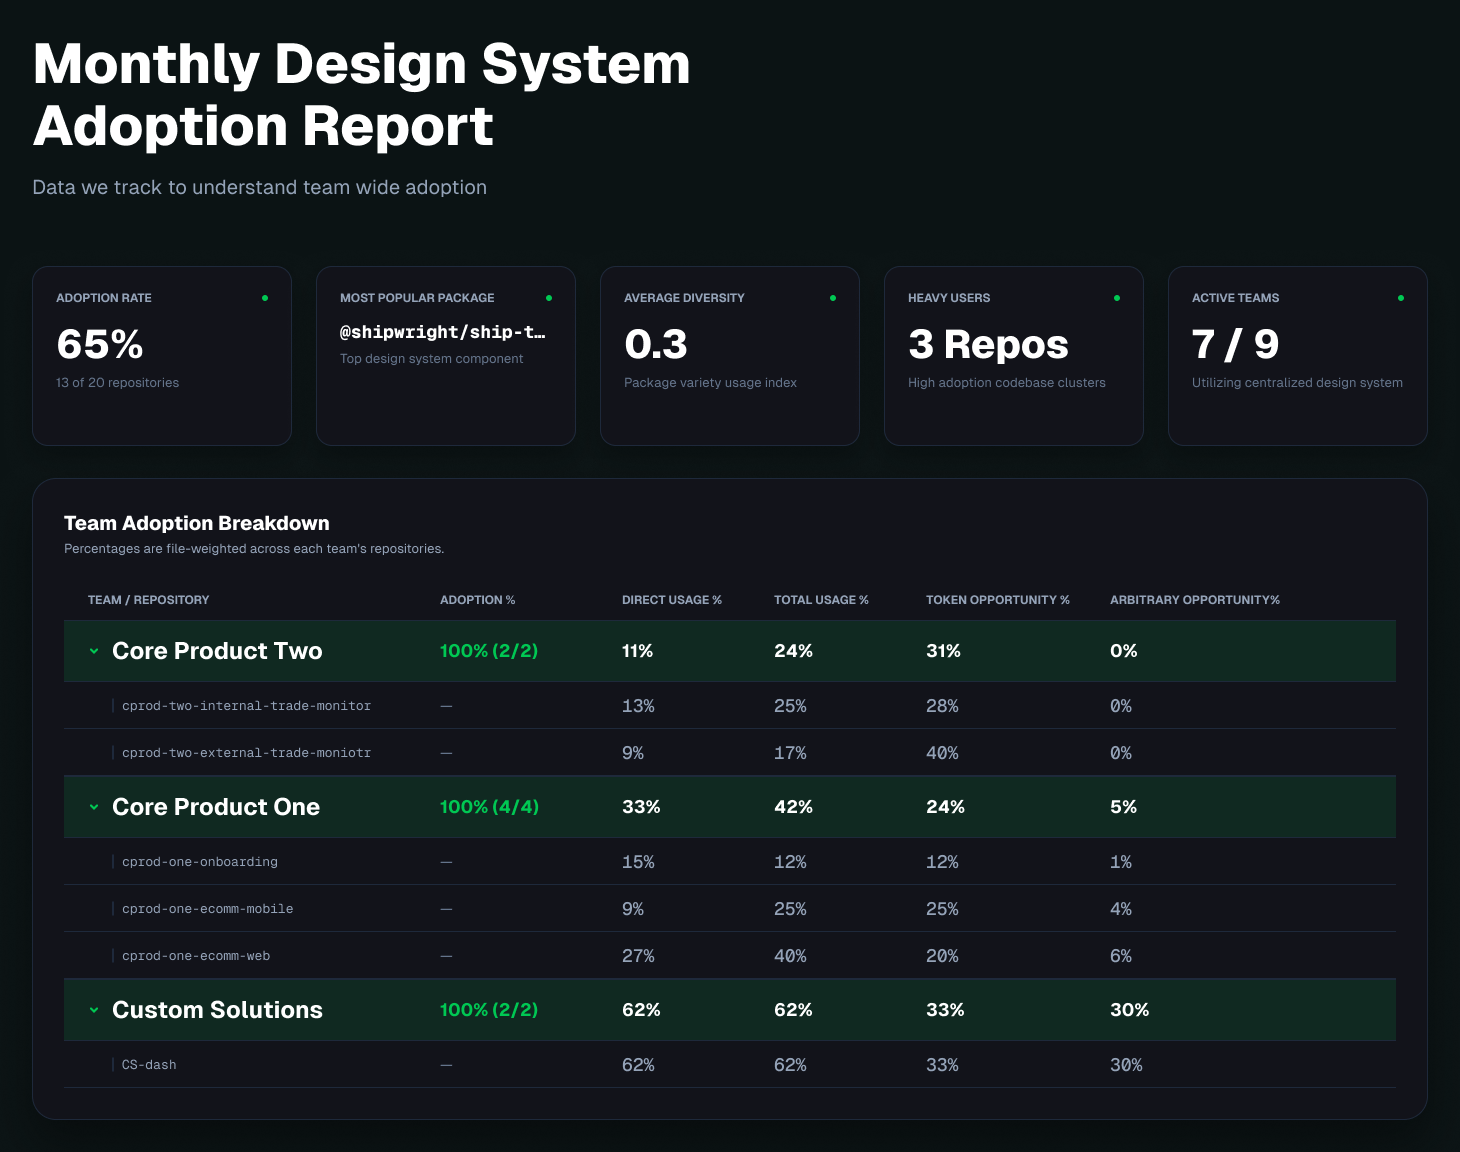
Our adoption report doesn't stop at "does this repo import our packages?" We break it down by team and by repo, and we separate four very different signals.
- Direct component usage - How much of the UI is built with system components?
- Token usage - Whether teams consume our design tokens even when they aren't using full components.
- Arbitrary values - The anti-signal. Hardcoded values that bypass the system entirely.
- Package diversity - Is a team using one component or thirty?
That last one matters more than it looks. A repo importing our text component and nothing else is technically adopted. A repository comprising 45 packages that form a real product surface has a completely different relationship with the system.
Token usage versus component usage tells a similar story. A team at 40% token coverage with low component usage might be theming their own components on our foundations. That's a very different conversation from a team ignoring both. It's often the moment to talk about extending the system with a product library.
The problem with adoption: it's a lagging indicator
Even great adoption reporting shares one structural weakness: codebases change slowly. By the time a team's adoption number drops, the relationship that produced the drop went bad months ago. That gap is where most design systems quietly lose ground. Adoption problems are older than AI, and they rarely announce themselves in a dashboard.
We wanted the leading indicator.
The AI workflow evolution is making the same mistake right now
There's a clean parallel unfolding in AI tooling, and it makes the problem obvious. Companies are rolling out AI tools and reporting on them the only way they know how: tokens consumed, seats activated, API calls made. The line goes up. AI transformation is happening.
The questions that matter sit one layer deeper. Are outputs shipping? Are people getting unstuck faster? Would they fight to keep the tool if you took it away?
Design systems have the same measurement gap. An import statement is a token burned. It tells you the system was touched. It doesn't tell you it helped. That's true even when you've done the harder work of connecting your design system to AI agents.
Engagement measures the relationship, not the artifact
A design system isn't a package registry. It's an ongoing collaboration between a platform team and the product teams it serves. Relationships have observable behaviors. People show up, ask questions, report problems, and contribute back. Those teams are comprised of designers, developers, and product owners, and with a successful design system implementation, they will be contributing and engaging with your team. So how do we measure this?
Office hours participation
Attendance at our open sessions is measured against an expected turnout scaled to total team size. Raw attendance means nothing on its own. Nine attendees is great from a team of 90 and alarming from a team of 900. Normalizing kept our numbers comparable month to month, even when a team might reorg or downsize.
Contribution participation
Feature requests, bug reports, component contributions, and documentation additions. Anything where a team puts effort into the system instead of only pulling from it. All of these contributions are positive signals that teams are leveraging the system.
Support participation
Questions asked and issues resolved. The volume of the conversation between us and our consumers.
How the three scores roll up
Each category gets a target proportional to team size. Each month's activity is normalized against that target. The three normalized scores roll up into a composite engagement score. We track a three-month rolling average and an index against our January baseline, so we can talk about trajectory instead of snapshots.
That's it. No tooling, no analytics platform. A spreadsheet and a monthly habit. It works because the rituals and cadences around a system are what keep it alive in the first place.

Noise is health, silence is the danger
If you read that list and thought, "Wait, bug reports count as a positive signal?" the answer is yes. Emphatically yes. This is the part that takes the most explaining to stakeholders and delivers the most insight once it lands. Getting that signal at all depends on how you gather feedback from teams and stakeholders in the first place.
A team filing bug reports is a team using your components on real work. They hit a wall and believed in the system enough to tell you instead of working around you. That's a healthy relationship. It's loud.
The dangerous teams are the quiet ones. Silence means one of two things. Either they aren't really using the system, or they hit problems and decided it was easier to fork, patch, or hardcode their way around you than to talk to you.
Both show up as pristine support metrics if you're measuring the naive way. Look, no complaints. And both end with a team churning off your system entirely.
What May looked like in our data
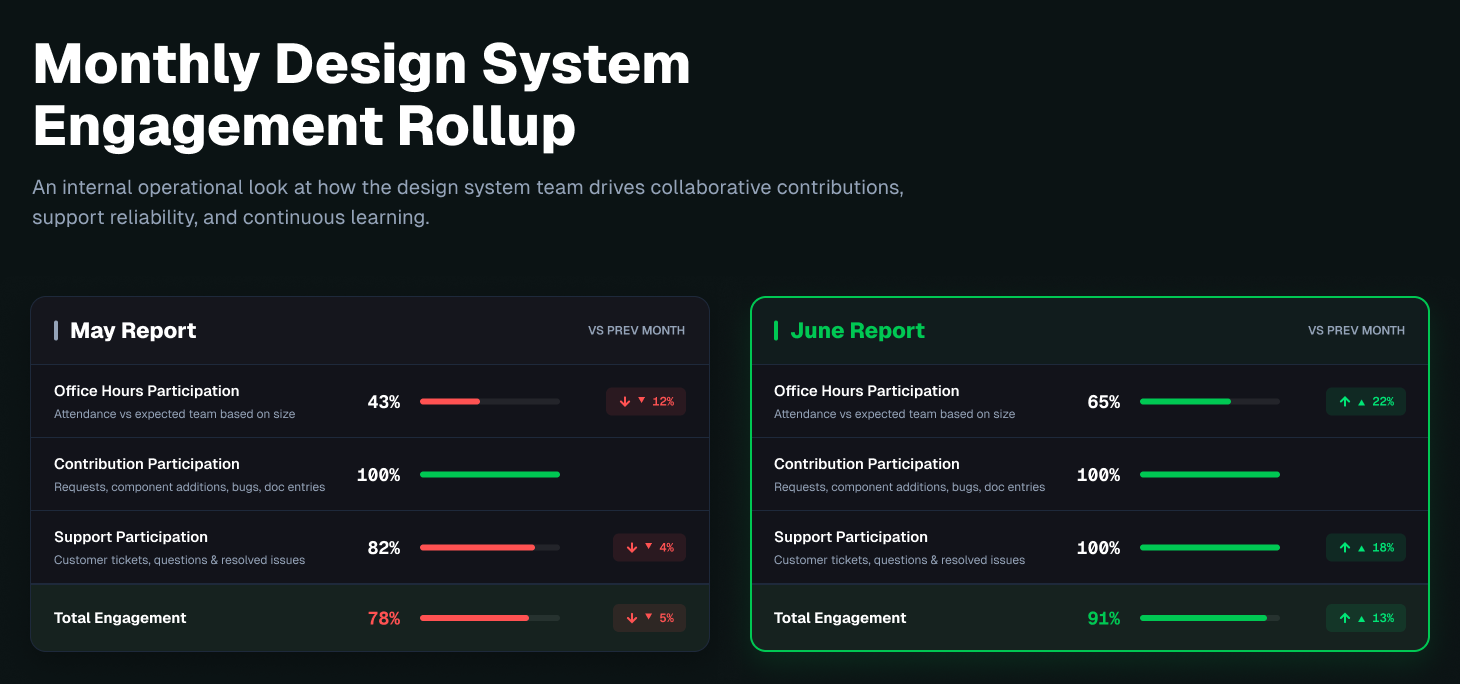
In May, our engagement score dropped from 95% to 79%.
Contribution participation was still at 100%. Teams were shipping components and docs into the system. But office hours attendance had cratered to 44% of the target, and support activity dipped.
Adoption that month? Unchanged. If adoption were our only lens, May would have looked fine.
The engagement data told a specific story. The system was still embedded in workflows, but the community around it was thinning. That's a different problem than low adoption, and it has a different fix: outreach, new agendas for office hours, going to teams instead of waiting for them.
We did that. June came back at 91%, with office hours recovering and support activity more than doubling.
That's the whole value proposition in one month. Engagement flagged a problem while it was still cheap to fix, long before it would have surfaced in an adoption report.
One honest caveat. The recovery proves the intervention fixed engagement. Whether it also protected adoption is something we're still watching, and we'll have a cleaner answer with a few more quarters of data.
Why engagement is worth tracking
Three payoffs, in the order they'll matter to you.
You get months of warning
Adoption is a codebase measurement, and codebases move slowly. A team can decide you aren't worth the trouble in March and still look fully adopted in July. Engagement moves the moment the relationship does.
You know which conversation to have
Adoption tells you a number is low. It doesn't tell you whether that team is blocked, uninterested, mid-migration, or quietly building their own version of your components. Engagement separates those cases, and each one needs a different response. Persuading a team that's already ramping wastes their time and yours.
You can defend the budget with something other than a percentage
This is the part that gets skipped. Every team that forks or hardcodes around your system is duplicating component work, creating divergent patterns across products, and a migration bill that lands on someone's roadmap eighteen months from now. That cost is real, and it's invisible in an adoption report until it's already been paid. Engagement is the earliest signal you can get that it's coming.
None of that requires new tooling. It requires counting things you're already generating.
How to read both metrics together
Neither metric replaces the other. The insight lives in the combination, and the simplest way to see it is a quadrant.
High adoption, low engagement is the quadrant that should worry you
These teams depend on your system but have no relationship with your team. They don't come to office hours, don't file issues, and don't contribute. The moment your system inconveniences them, whether that's a breaking change, a missing component, or a deadline crunch, they'll fork or drift. You won't know until the percentage of arbitrary values in your adoption report starts creeping up.
Low adoption, high engagement is the pleasant surprise
In our reporting, we have teams sitting at 33% adoption, and some at 0%. Adoption alone calls that a failure. But if those teams show up to office hours and ask questions, they aren't resisting. They're ramping.
That changes the playbook completely. A resistant team needs persuasion and executive sponsorship. A ramping team needs migration support and patience. Treating them the same wastes everyone's time.
One dataset, two audiences
We built this for two readers, and it's earned its keep with both.
Looking up, to stakeholders and leadership. Engagement trends prove the design system is a living program, not shelfware that got installed once. We report it as a simple monthly card: three participation percentages, a total engagement score, and an up or down arrow against last month. Leadership doesn't need the spreadsheet mechanics. They need a trajectory, and they need it tied to money. Rising engagement means fewer teams quietly building their own version of a component you already ship. Falling engagement means that duplicated work is getting scheduled somewhere you can't see it yet. If you're building that muscle, our design system stakeholder guide goes deeper on translating progress into business value.
Looking down, to our own team. Engagement is our early warning system. A dip in one pillar tells us not just that something's off, but what kind of something.
- Contribution drops mean the system isn't keeping pace with product needs.
- Support drops mean teams have stopped talking to us.
- Office hours drops mean the community layer is weakening.
Each has a different intervention, and the data routes us to the right one before the problem hardens into an adoption decline.
How to start: it's a spreadsheet, not a platform
If you want to build this for your own system, resist the urge to over-engineer it.
- Pick two or three signals you can observe every month. Office hours attendance, support channel activity, and contributions are a good starter set. Most teams already generate this data. You just aren't counting it.
- Set targets proportional to your audience size, and recalculate when your org changes. Absolute numbers lie. Normalized numbers travel.
- Composite the normalized scores and track a rolling average. Individual months are noisy. Trends are the signal.
- Report it alongside adoption, never instead of it. They answer different questions, and stakeholders should see both.
Two guardrails before you ship it.
First, never weaponize the score against teams. The moment engagement becomes something teams get punished for, they'll stop being honest with you, and honesty is the entire asset.
Second, watch for Goodhart's Law: “When a measure becomes a target, it ceases to be a good measure.” If office hours attendance becomes a quota, people will attend to be counted, and the number stops meaning anything. These are diagnostic instruments, not performance targets.
This works best when the system itself is worth engaging with. If you're still deciding whether to build one, start with when designers should build a custom design system from scratch.
Adoption gets you in the room. Engagement keeps you there.
The AI industry and the design systems discipline are converging on the same lesson from opposite directions. Usage is easy to count and easy to misread. Tokens burned and packages imported tell you a tool is present, not that it's working.
Effectiveness lives in the relationship. It's in the questions asked, the bugs filed, the components contributed, and the people who keep showing up. Those things are harder to put on a dashboard, but they're the difference between a system teams depend on and a system teams merely inherit.
So measure adoption. Break it down properly, components versus tokens, direct versus transitive, and keep an eye on those arbitrary values. Then pair it with engagement.
And if your engagement data is quiet? Don't celebrate. Go find out why.
If you want help building a system that teams actually engage with, our design systems crew can help. We go deeper on this in our design systems presentation. Or just book a free call, and we'll talk through where yours stands.